Basemap and xkcd() in Matplotlib
September 15, 2017 •I have been following santdex's YouTube for Python-related series. Although I have been using matplotlib for super quick charting, I had never paid much attention what goes under the hood and barely used customisations.
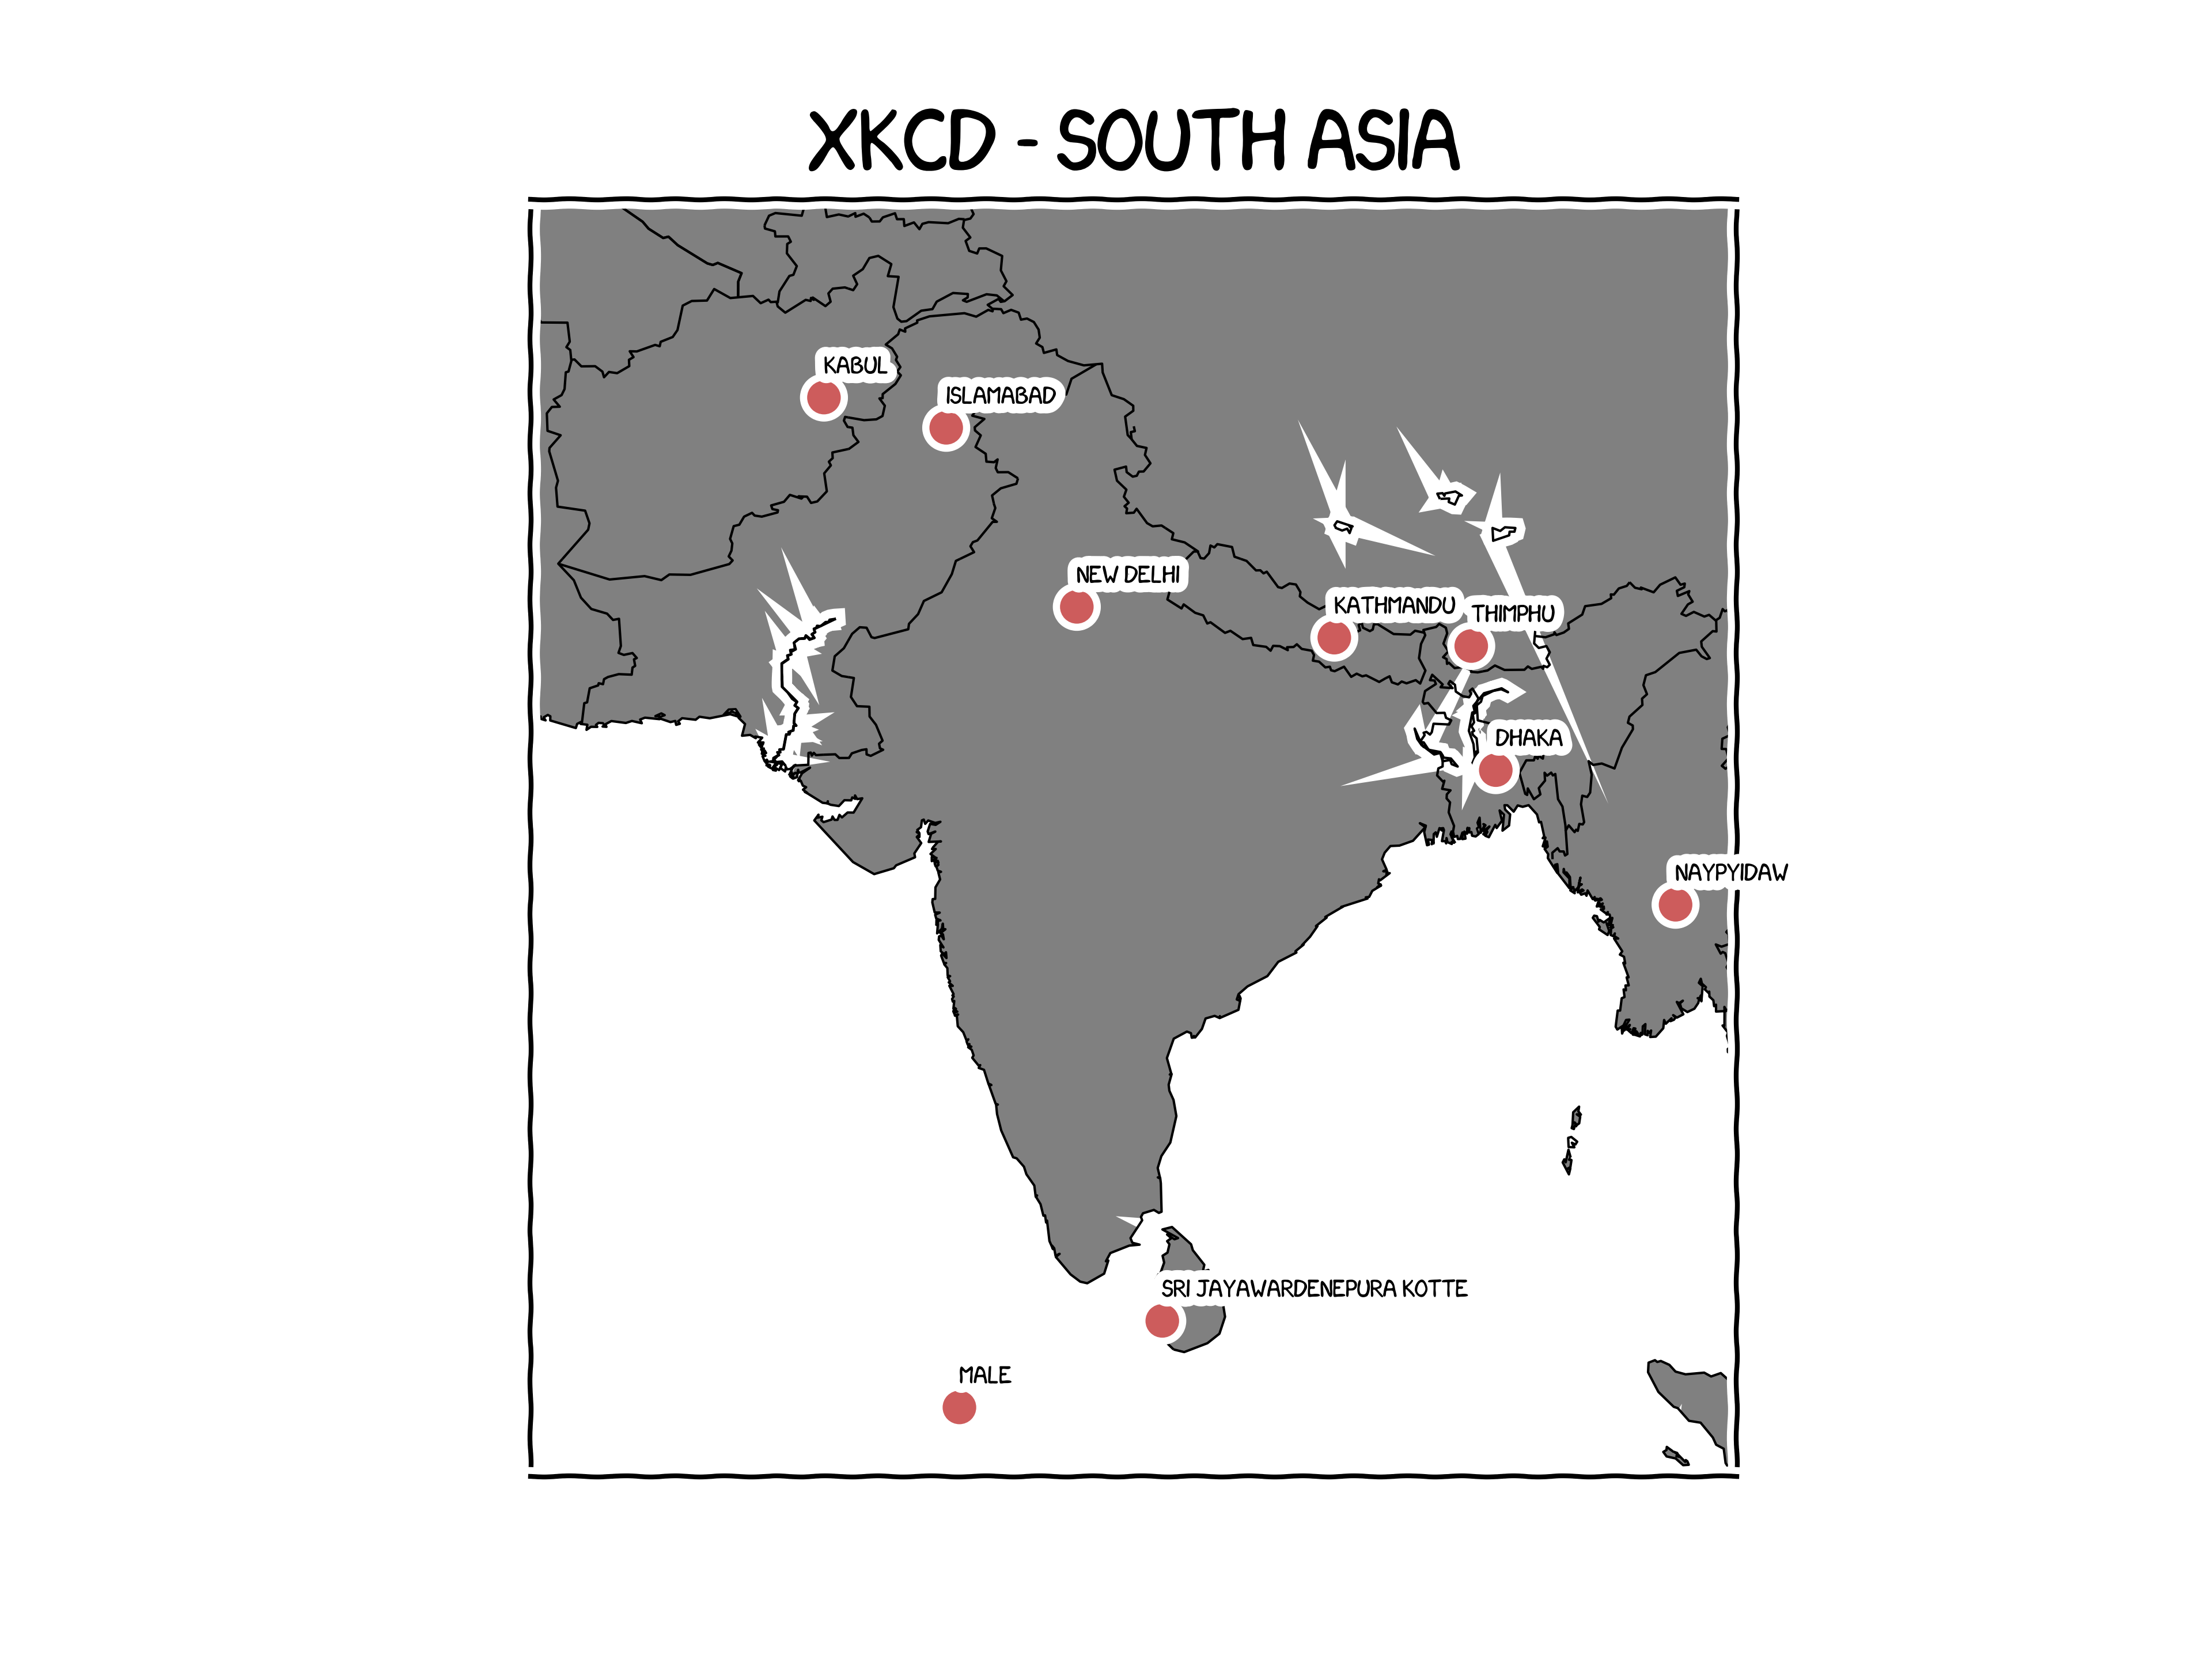
Yet another 'binge' watching - Matplotlib Tutorial Series - Graphing in Python. And, for your viewing pleasure xkcd styled map of South Asia.
from mpl_toolkits.basemap import Basemap
import matplotlib.pyplot as plt
import matplotlib
import pandas as pd
import requests

plt.xkcd()


font = {
        'family': 'xkcd',
        'size'   : 4.5}

matplotlib.rc('font', **font)

#get capital cities' coordinates
url = 'https://docs.google.com/spreadsheets/d/e/2PACX-1vQT6XItC-X5LNOYb2Nh7kPk5ANxHkoFLX8wRXBD0ywD8zNDRCdTKCt0V6bw9A3Y4XLCpgs-NDNUr-Qm/pub?gid=1498534080&single=true&output=csv'
df = pd.read_csv(url)


ax1 = plt.subplot(111)

m = Basemap(projection = 'mill',
            llcrnrlat=2,llcrnrlon=60,urcrnrlat=40, urcrnrlon=98,
            ax = ax1)
m.drawcountries(linewidth=0.5)
m.drawcoastlines(linewidth=0.5)
m.fillcontinents(color="grey")
m.drawmapboundary()


for point in range(len(df)):
    x,y = m(df.Longitude[point], df.Latitude[point])
    ax1.annotate(df.Capital[point], xy=(x,y), xycoords='data',
                textcoords='offset points', xytext=(0,5))
    ax1.plot(x,y, marker='o', color='indianred')

plt.title('xkcd - South Asia', size=16)

#saving file
#plt.savefig('xkcd_southasia.png', format='png', dpi=600)

plt.show()
Check out xkcd showcase in matplotlib site for more