CSV from Drishti KTM Valley Air Quality
August 18, 2016 •I ran across a couple posts on Drishti Kathmandu recently. I was excited to read, as some tweets indicated, Drishti Kathmandu had installed low-cost pollution monitoring stations in various spots in the valley and would be sharing real-time air quality monitoring data.
Drishti Kathmandu maintains a Google Sheets. The sheet gets updated every hour but the readings don't change much though. Besides, I was disappointed the sheets provided just a snapshot of the past 24 hours data. I wish they had shared more data or perhaps API - researchers and data enthusiasts would have appreciated it. Once I even wrote to the group admin but never heard back.
As a weekend project, I wrote a python script to scrap the sheets and append reading to CSV file.
Primarily, I have used CLiPs pattern module for screen scrapping. Regular expression re module to clean up HTML.
The CSV file looks as follows
date,time,place,reading,type
"Sunday,July 31,2016","08:00 AM","GONGABU",9,R
"Sunday,July 31,2016","11:00 AM","KALANKI",29,R
"Sunday,July 31,2016","10:00 AM","KOTESHWOR",15,R
"Sunday,July 31,2016","06:00 AM","NEW BANESHWOR",37,R
"Sunday,July 31,2016","11:00 AM","PUTALISADAK",19,R
"Sunday,July 31,2016","11:00 AM","KALANKI",18,R
...
...
"Thursday,August 18,2016","10:00 AM","GONGABU",12,H
"Thursday,August 18,2016","10:00 AM","KALANKI",63,H
"Thursday,August 18,2016","09:00 AM","KOTESHWOR",83,H
"Wednesday,August 17,2016","09:00 AM","MAHARAJGUNJ",34,H
"Wednesday,August 17,2016","00:00 PM","PUTALISADAK",29,H
"Wednesday,August 17,2016","07:00 AM","SAATDOBATO",44,H
"Wednesday,August 17,2016","08:00 PM","THAPATHALI",95,H
The flags R and H mean hourly reading and the highest in the past 24 hours respectively.
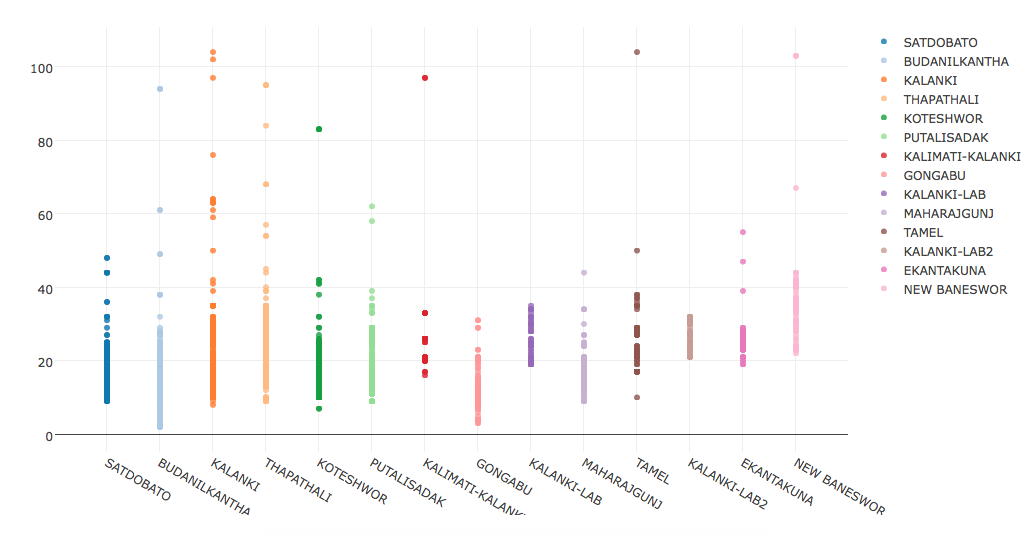
Graph generated from the data collected in about a month
Related tweets
Exceptionally good #air today #airpollution #drishtikathmandu #kathmandu
— Vogmask Nepal (@vogmask_nepal) July 4, 2016
realtime data @ https://t.co/4TaS5UKf2J pic.twitter.com/kIa6Kc2Uxp
Glad to see KTM's #AirQuality data (updated every 5 mins from 9 spots). Hope it's used for action #DrishtiKathmandu https://t.co/yNaLxaWli2
— Bhushan Tuladhar (@BhushanTuladhar) July 3, 2016