Kantipur 2014 News Visualization
July 22, 2015 •Scraped almost 150,000 rows of data from kantipur.ekantipur.com during the weekend.
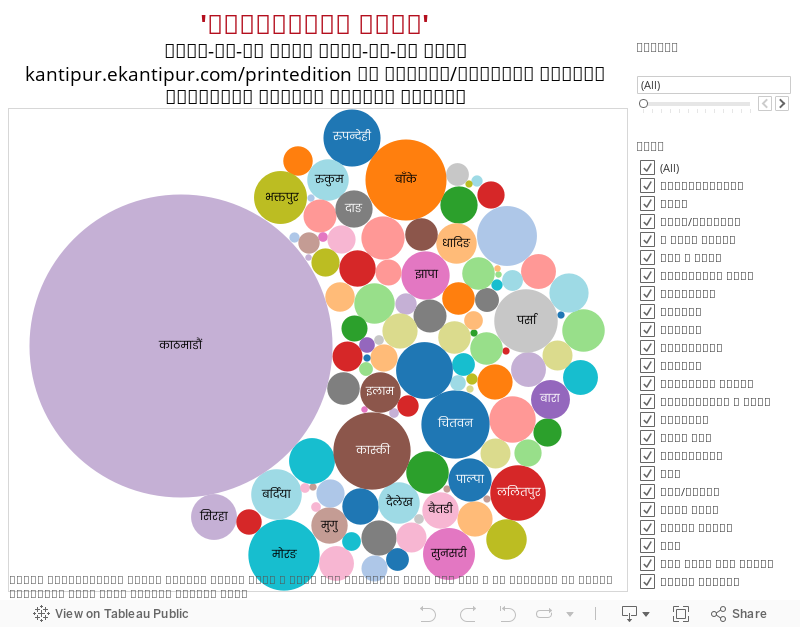
For this visualisation I have used the titles published from January 1, 2014 to December 31, 2014 under different sections in Kantipur portal.
The data may not be 100% accurate because the data hasn't yet been throughly cleaned. Besides, I came across a few glitches while pulling the data from their 'paperissue' archive.
Anyway, here's two Kantipur 2014 on graphs - until I format rest of the data.